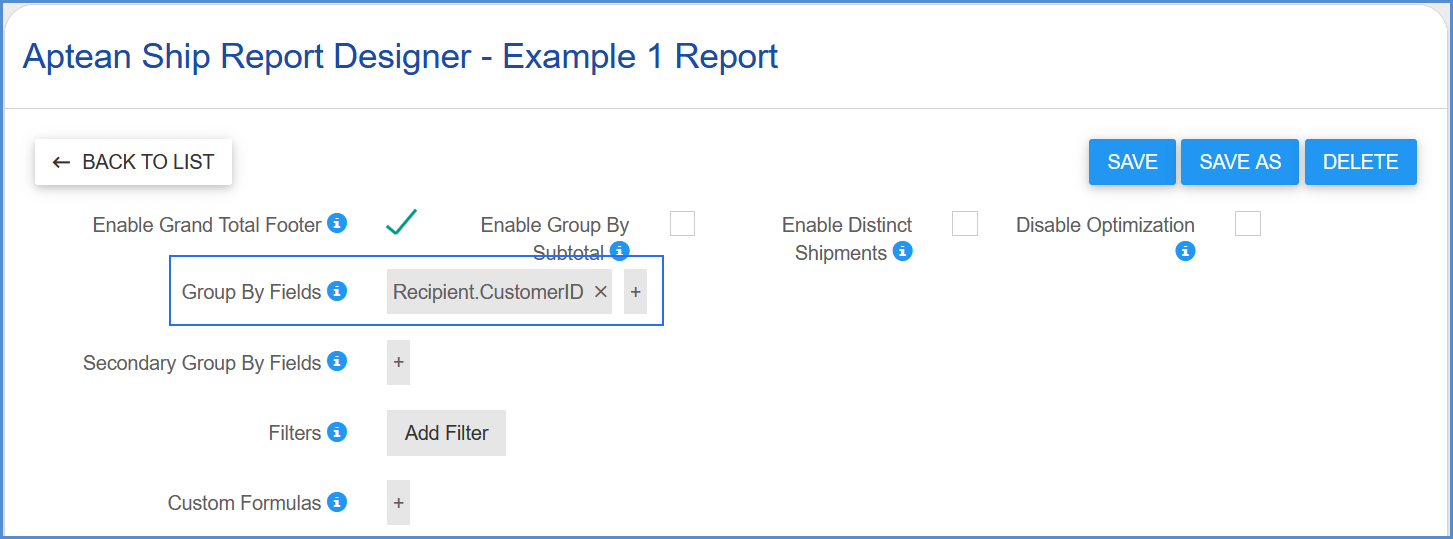
To create a new report in the Report Designer that will be available in Dashboard > Reports, click the New Report button. You can also choose to edit an existing Aptean Ship report by clicking the Edit button and then, after making modifications, “Save As” to a new name. This topic covers each part of a report to assist you when configuring new or existing reports.
Report Options
Add a Grand Total Footer
A quick way to create a report grand total at the end of the report is to check the “Enable Grand Total Footer” check box. This will add a grand total to the footer. Note that if you define a footer in your report, this option will be ignored.
Group Your Data
You can organize your report by selecting the fields into which you want to group data. Shipments with the same value defined by the “Group By” field will be grouped together in the report.
Create Secondary Groups
Groups can be nested so that you can easily identify the relationships among the groups and find the information you want quickly. You can also create subgroups by enabling the “Secondary Group By Fields” option and selecting the shipment fields to group.
More Customization
Use the Custom Formulas field to further customize the report using your own JavaScript or using the examples provided in the dialog box.
We have provided the following predefined functions to help you compose Custom Formulas:
- ReportUtils.get($data, path)
- ReportUtils.first($data, path)
- ReportUtils.sum($data, path)
- ReportUtils.toDate($data, path)
- ReportUtils.combine($data, path)
- ReportUtils.toCurrency($data, path)
- ReportUtils.toWeight($data, path)
- ReportUtils.hasOption($data, option, isPackOption)
Filters
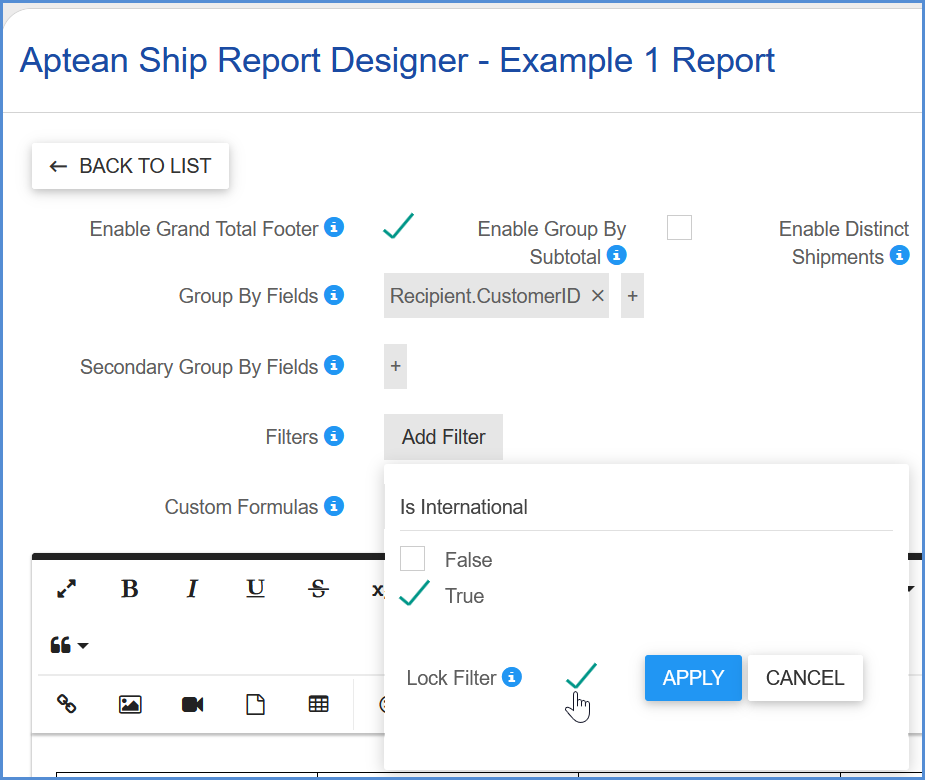
You can further narrow down report results by selecting filters. The filter values can be modified and saved in Dashboard > Reports as Variations.
Remove Redundant Data
When the “Enable Distinct Shipments” option is checked, shipments containing duplicate data presented in the report will be filtered out.
Data Optimization
Data is optimized when you summarize it and display it in the best way possible. Aptean Ship Reports are automatically optimized to get only the data that is needed. Sometimes, the optimization logic can potentially be incorrect. If your report is missing data, select the “Disable Optimization” option.
Report Content
Add a Header
To add a Header to the report table, click in the cell and select the H.
Add a Footer
To add a Footer to the report table, click in the cell and select the F.
Add Data
Now it’s time to add the data you want to present in the report. Click inside the cell where you want to add the data and select the Edit Cell Properties button.
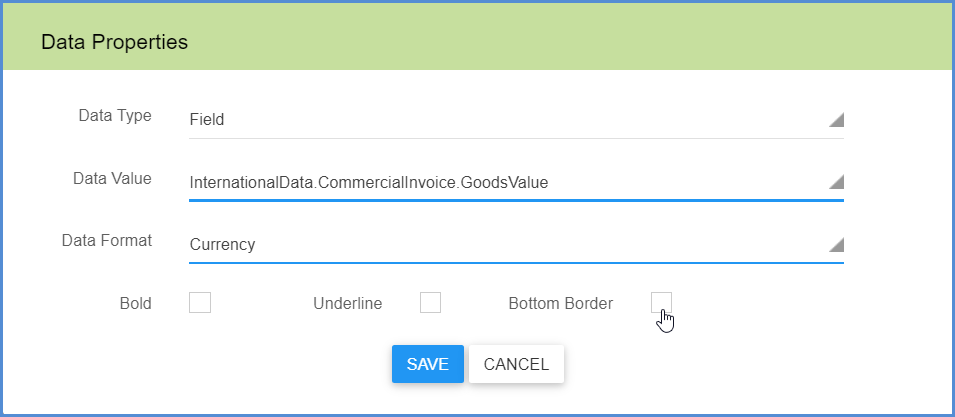
In the Data Properties dialog, configure the data to insert by selecting the Data Type, Data Value, and Data Format. You can also add some formatting by selecting Bold, Underline, or Bottom Border.
Row Properties
The Row Properties button allows you to define the Band Types that will appear in the report. A Band is a specific row on the report table, used to define how to render report controls that belong to it, their rendering order and how many times they are rendered.
Available Bands are Line Items, Orders, Packs, and Pallets. For example, if you selected the Line Items Band and a shipment has three items, the band would repeat 3 times, once for each item. Bands of the same type that are adjacent to one another will group the rows together while repeating.
To edit the row properties, click in a cell and select the Edit Row button. The dialog allows you to specify the Band Type and the maximum number of records to include in the band. If you leave the default setting, which is “0”, this allows for an unlimited number of records to be included.
Formatting Options
Typical formatting options are available from the toolbar or by clicking in a cell.
Links, Images and More
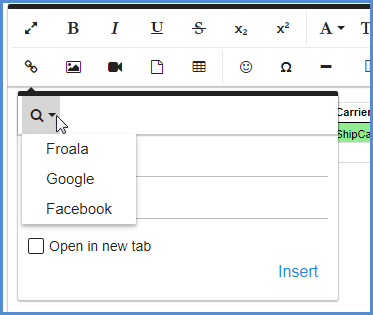
- The Insert Link button allows you to add a URL and Title to a cell, which you can configure to open in a new tab.
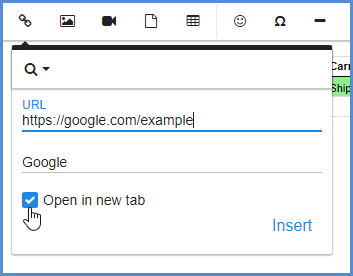
You can also click the Choose Link button to insert a predefined link such as Froala, Google, or Facebook.
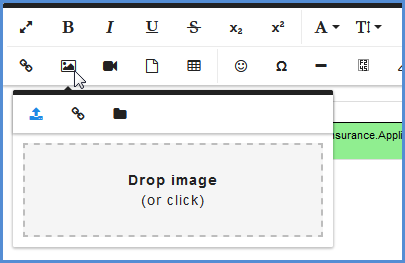
- Click the Insert Image button to add an image to the report. Images can be added by uploading a file (or dragging and dropping to the image box) or by URL. You can also click Browse to select a Letterhead or Signature image that you’ve already added under Setup > Company > Edit Address > Images.
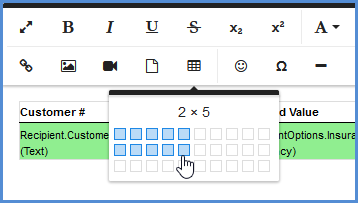
- Tables can be added to a report by clicking the Insert Table button and selecting the number of columns and rows to include. Note that a report can only contain one table. If a table already exists in the report, add a new report.
- Be sure to explore the many options that are available on the toolbar, such as adding a video, special characters, emoticons, and other formatting options.


